
Overview Analytics is Zoomph's core analytics report providing a summary of your key content metrics and audience insights .
Overview Analytics can be accessed via the action buttons next to a feed.

Content Metrics
At the top of the report, you'll first see a set of core metrics for your feed. In the upper right-hand corner, you'll also see a breakdown of which social channels your feed's content is coming from.
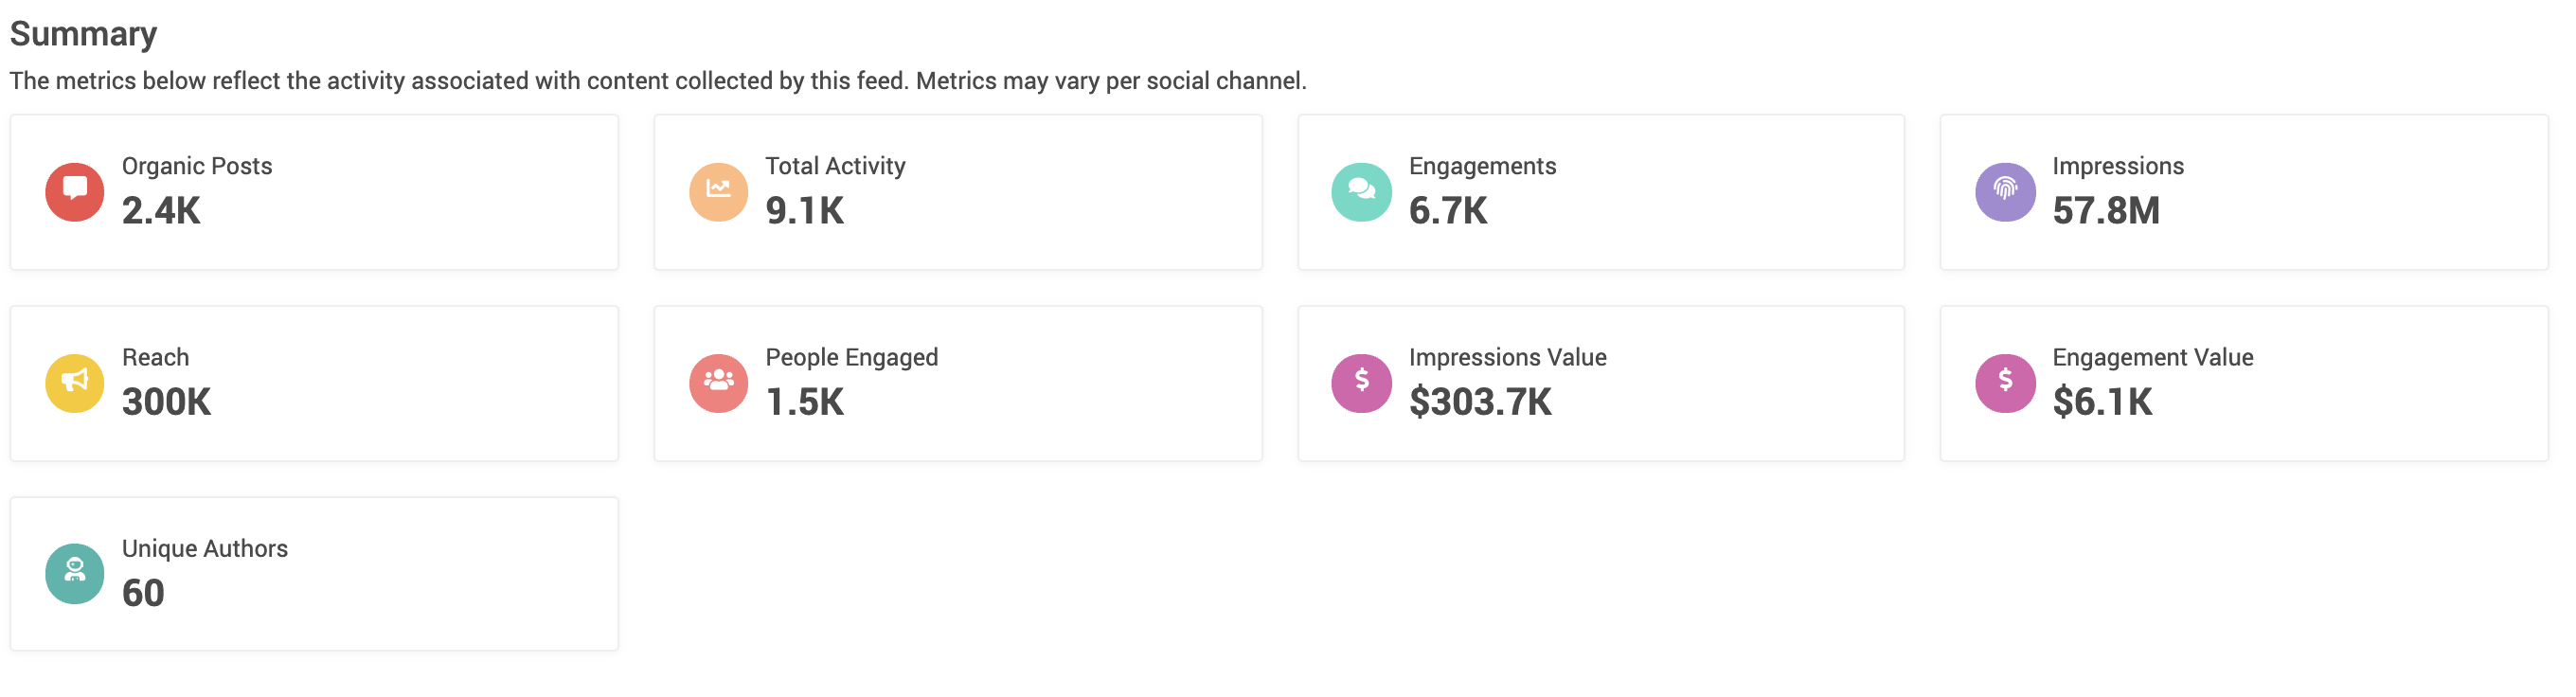
Organic Posts: The total number of original post across all sources, not including retweets and replies and comments.
Total Activity: This is the total number of social posts that matched your search terms and were pulled into the feed. There is also a normalized activity number for benchmarking against other feeds and campaigns.
Engagements: The total number of interactions, such as likes and retweets, on all posts collected by the feed.
Impressions: The maximum number of potential views on the content in this feed. This differs from audience reach which considers the number of unique views.
Total ZPoints: This number measures the total amount of influence in your feed using ZPoints. This is a total number of ZPoints based on the ZPoints of all of your feed's content. There is also normalized ZPoints provided for benchmarking against other feeds and campaigns.
Unique Authors: This measures the total number of unique social profiles that authored all of the content related to your search terms.
People Engaged: This measures the social community that was directly involved in conversations relating to this campaign. The metric is the distinct number of social profiles that have either contributed to or have been directly mentioned in all of the content relating to this campaign.
Impression Value: This measures the value determined by calculation the industry-standard price for 1,000 social impressions. This is a measure of social media advertising cost.
Engagement Value: This measures the value determined by calculation the industry-standard price for 1,000 social engagements. This is a measure of social media advertising cost.
As is the case with all of our analytic reports, you can apply advanced filtering, using the filter menu in the top-right corner of the page to deep dive into your data for more detailed insights.
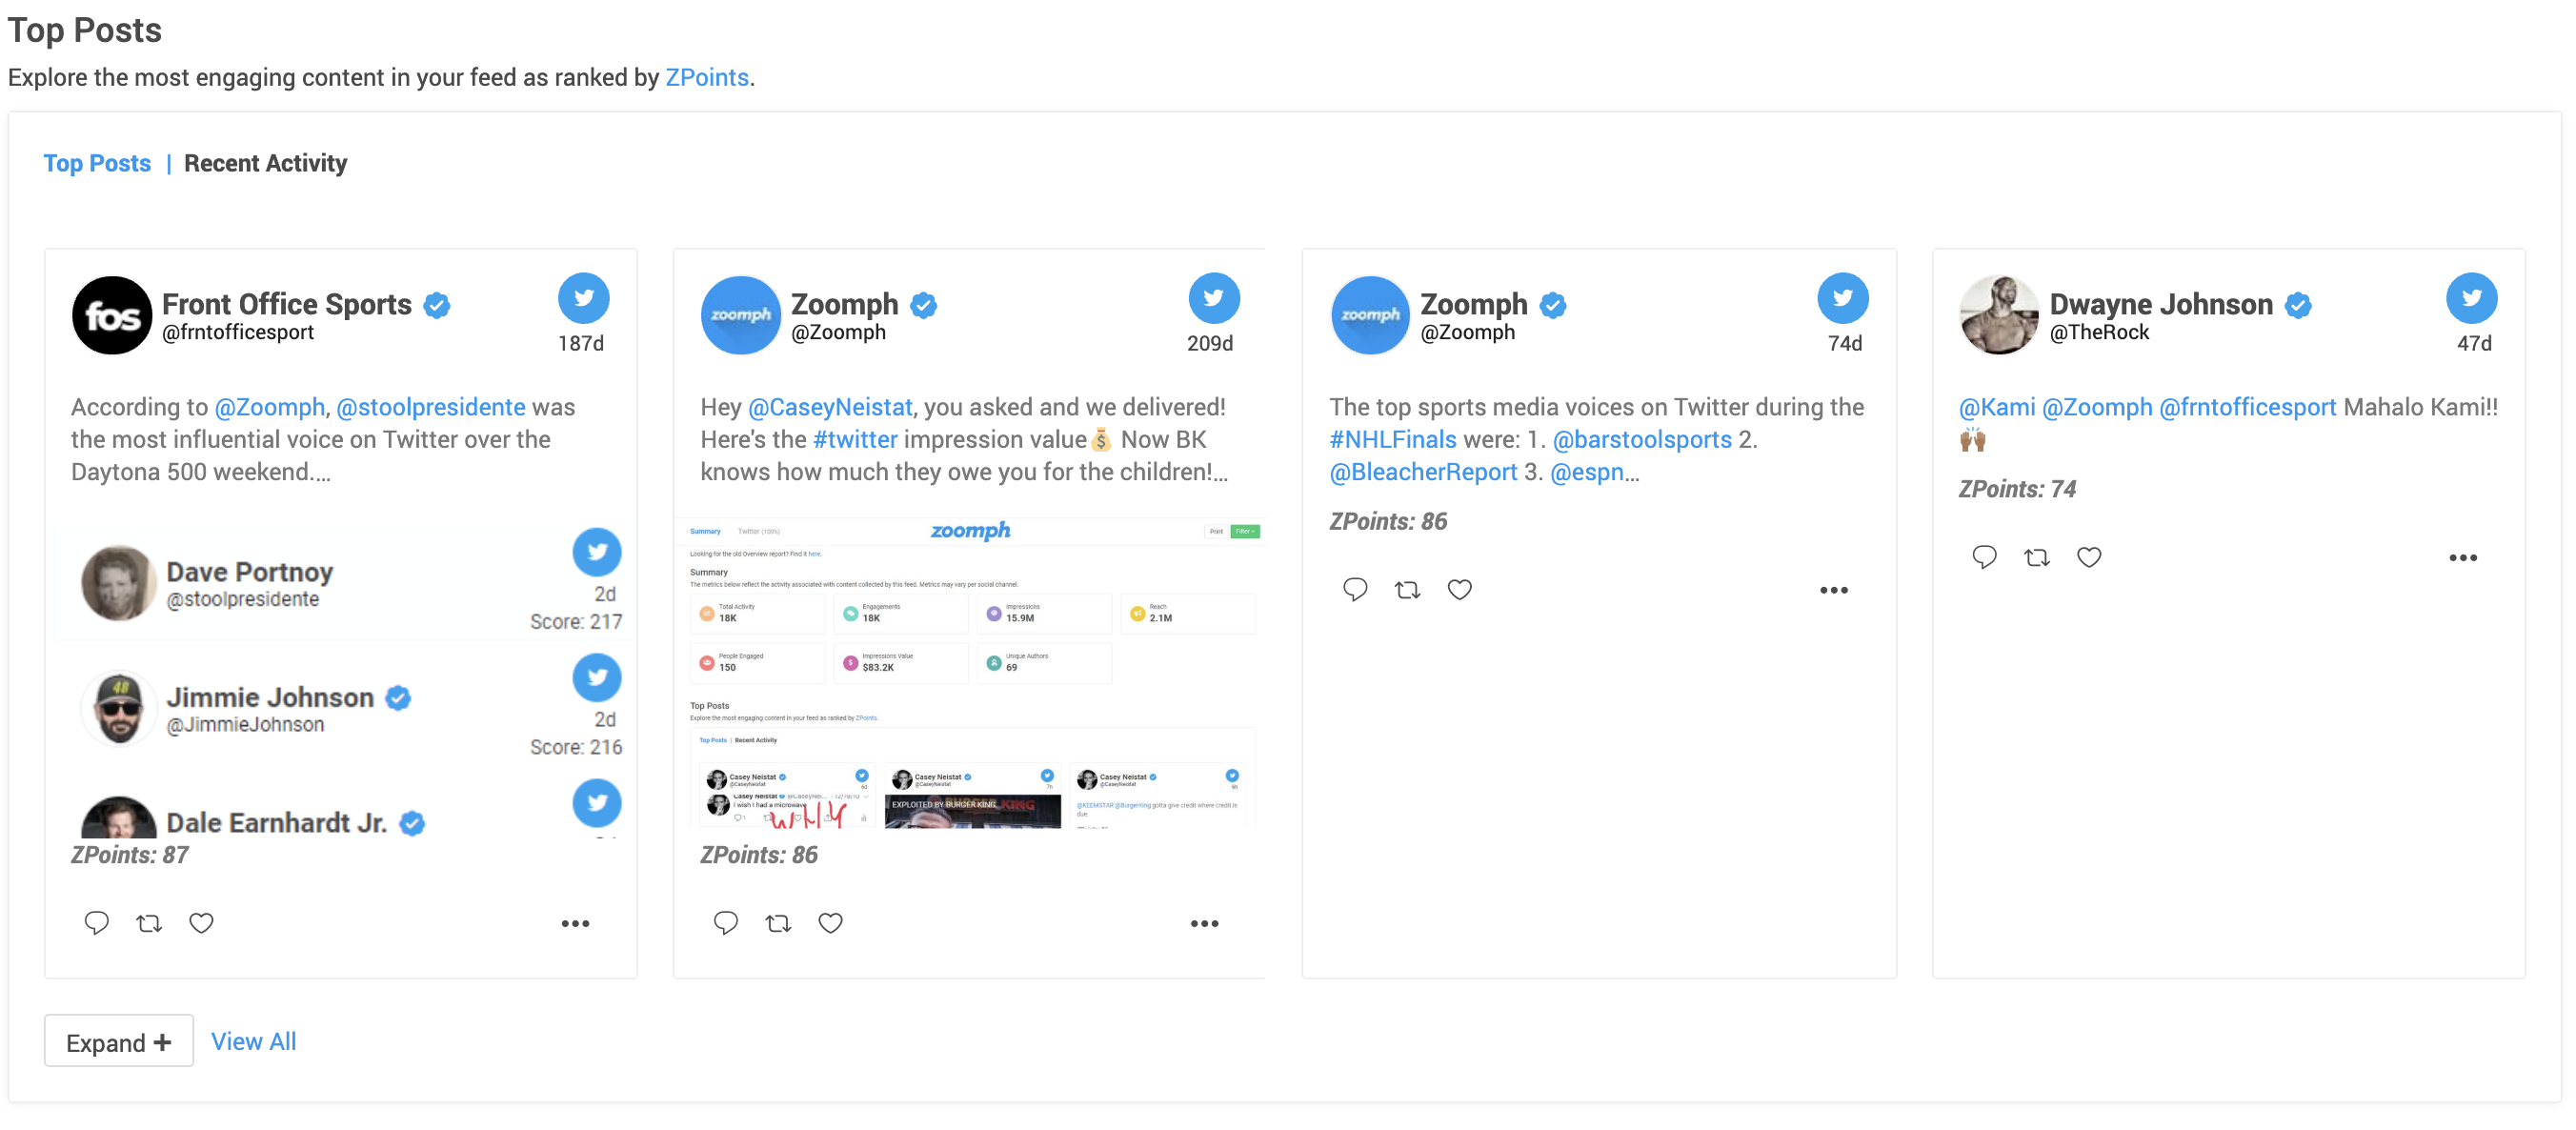
Top Posts
The Top Posts chart provides a visual representation of the most engaging content in your feed rank by ZPoints. This can be sorted time, with Recent Activity or Top Posts. This can also be expanded for more posts to be viewed, as well, you can interact with and moderate posts in the widget without having to leave the overview page as well.
 Activity Over Time
The Activity Over Time chart provides a visual representation of how much engagement your campaign received over a defined period of time.
Studying the activity over time chart will help you understand the times of your campaign that your audience was most engaged, and may have triggered increases in activity.
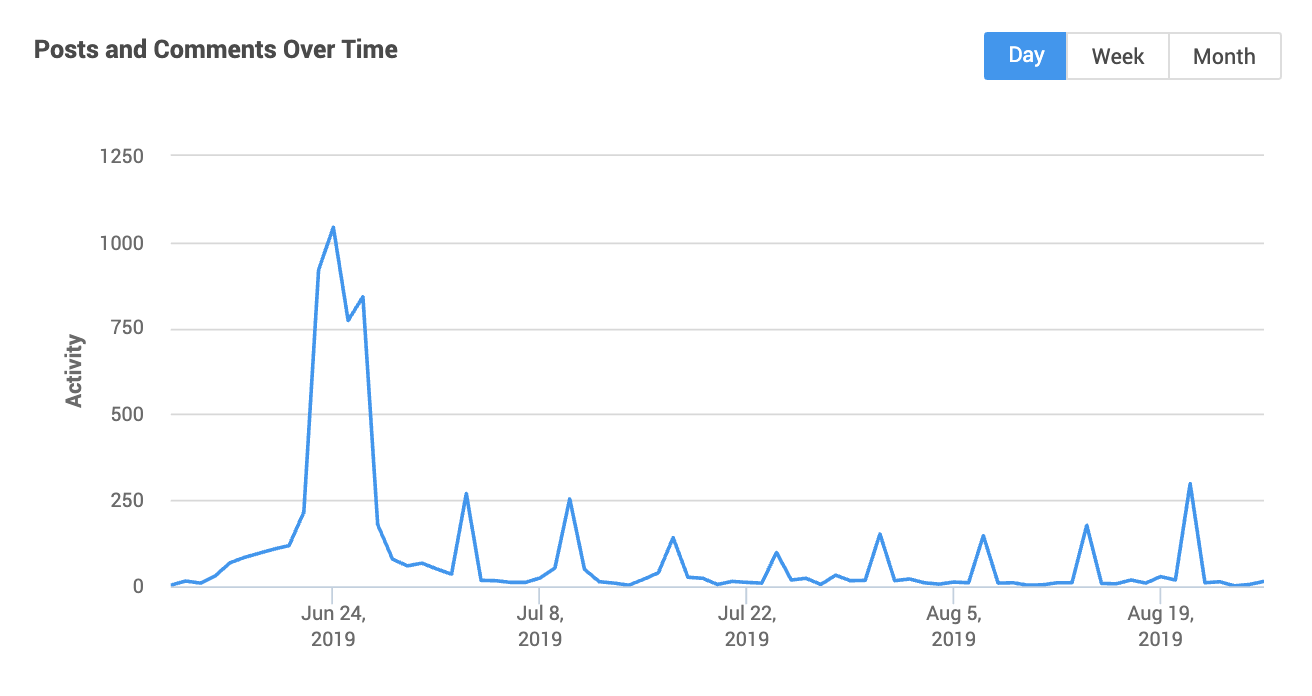
The activity over time chart allows you to zoom into specific time periods of your campaign so that you gain insights into certain periods of activity. Simply click and drag across the period on the chart that you would like to dive into.
Simply click and drag across the time period on the chart that you would like to dive into. You will see that all of the analytics on the overview page will update to reflect the time period you are viewing.
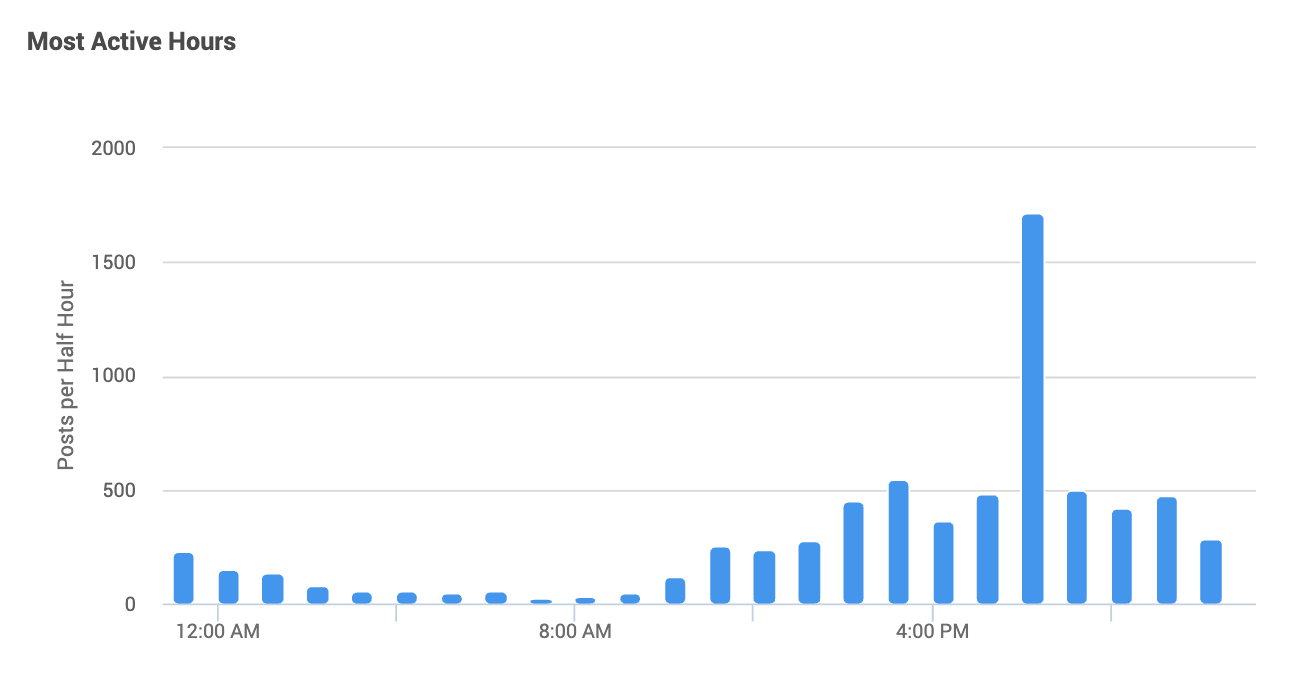
Most Active Hours
Time of Day Breakdown shows you when your audience is most active as it relates to your campaign.
Pro Tip: Use this information as a hint into when you should post and schedule your content and messaging so to increase the likelihood that your audience(s) and influencers will see and engage with your content.
Audience Demographics
Zoomph's audience demographic breakdowns provide you insights into the type of people that are engaging with your campaign.
With demographic breakdowns, you will now be able to understand who your messages resonate with, and who you may want to target more specifically with your with future strategies.
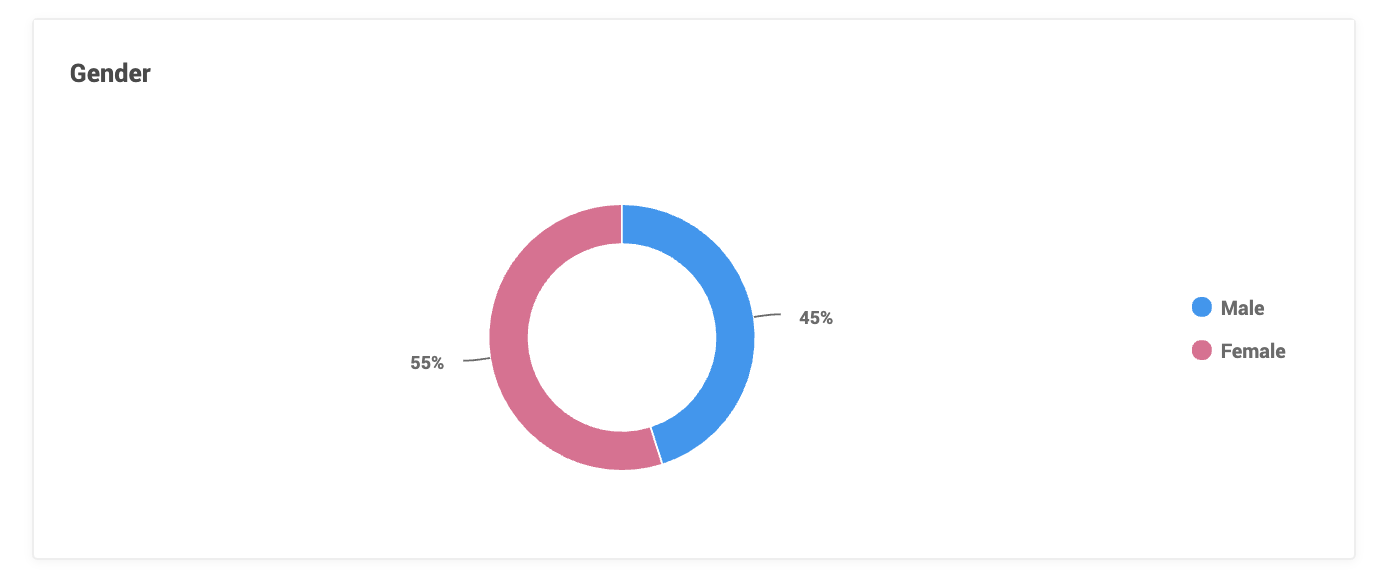
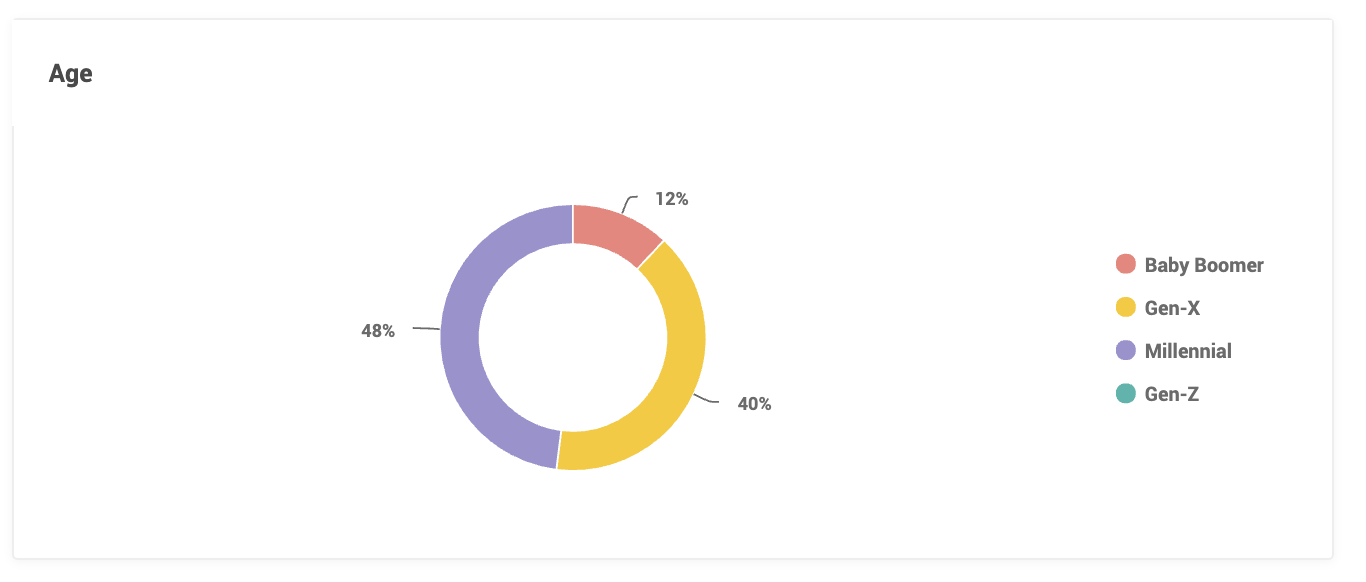
There are percentage breakdowns for Gender and Generation (age).
The breakdown for the Generation data is as follows:
- Gen Z -people born after 2005.
- This generation has grown up in the social age and are digital natives.
- Millennials - people born after 1985.
- This generation is the largest generation in history and is poised to move into their prime spending years.
- Gen X - people born after 1965.
- Baby Boomers - people born after 1945.
- The demographic charts can be downloaded by clicking the hamburger menu in the top-right corner of each respective chart.
We have a patented statistical/probabilistic algorithm that predicts demographics and other attributes.
It factors a variety of cues provided in social media data from both posts as well as author bios and author names. This data is overlayed with publicly available data from US census, Social Security Administration, Global Web Index and a variety of other sources that Zoomph purchases.
Likewise with information from public data we can predict age-ranges - for example certain names drop in popularity over time - "Joyce" was more popular as a first name in 1946 (15,212 girls born were given that name) than it is today (< 500 girls born were given that name) versus "Emily," which is a much more popular name today than it was in 1946.
The actual algorithm is more complex than simple probability though to factor a variety of data conditions - the process is documented in https://www.google.com/patents/US9524469.
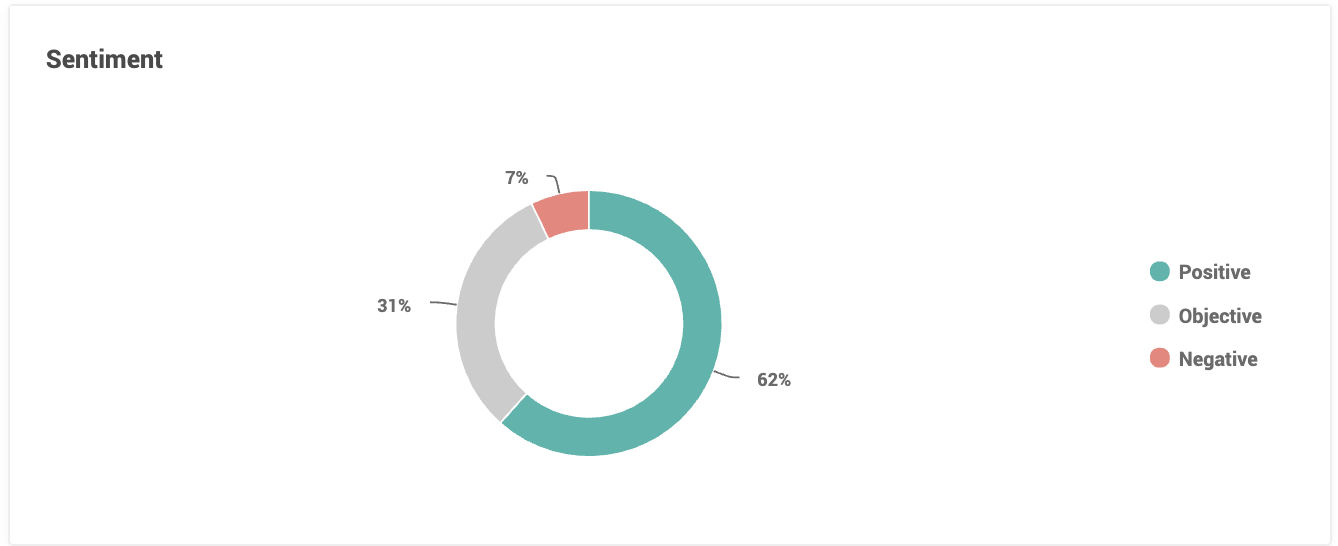
Sentiment
The sentiment widget shows a breakdown of the percentage of posts in your feed that are classified as positive, negative, or objective.
You can view a more detailed sentiment report via the link at the bottom widget, or the link in your left navigation menu.
Heat Map
The Heat Map on the overview page gives a high level into where in the world all of your social content is coming from. The darker areas on the map are "hot" locations for your feed where the majority of your content is being originated.
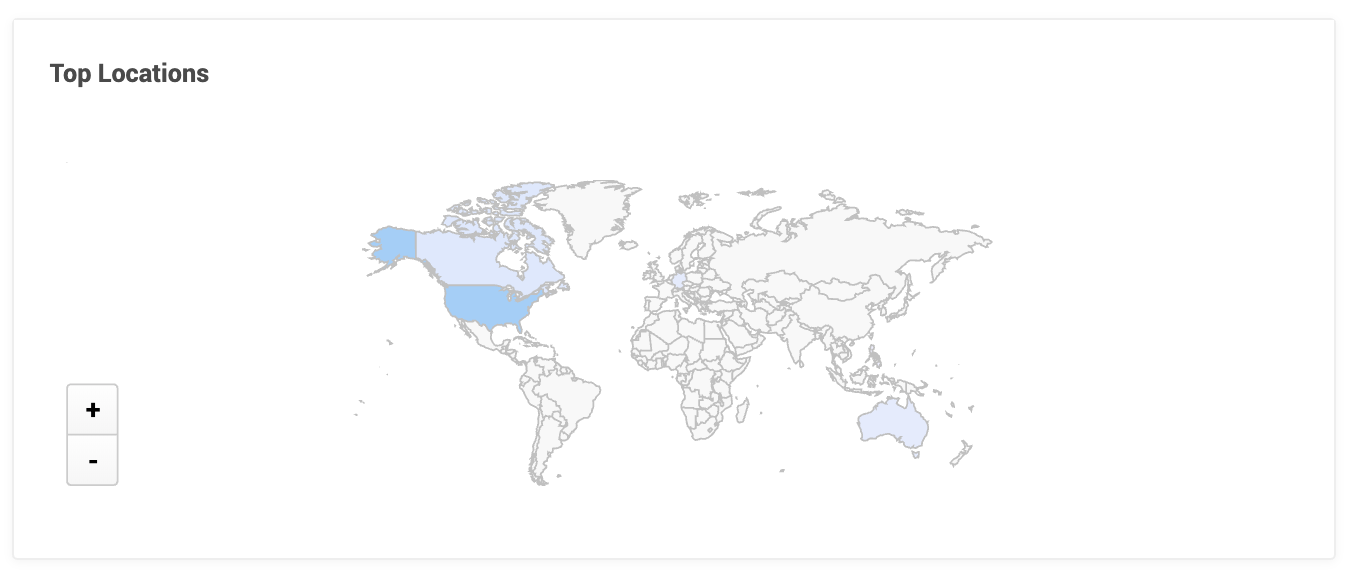
To view a more detailed Geographic breakdown, you can click the "View in Geolocation" link below the map, or navigate to the Geolocation page via the analytics navigation bar.
Geographic is derived from the shared location from which an author posts from.
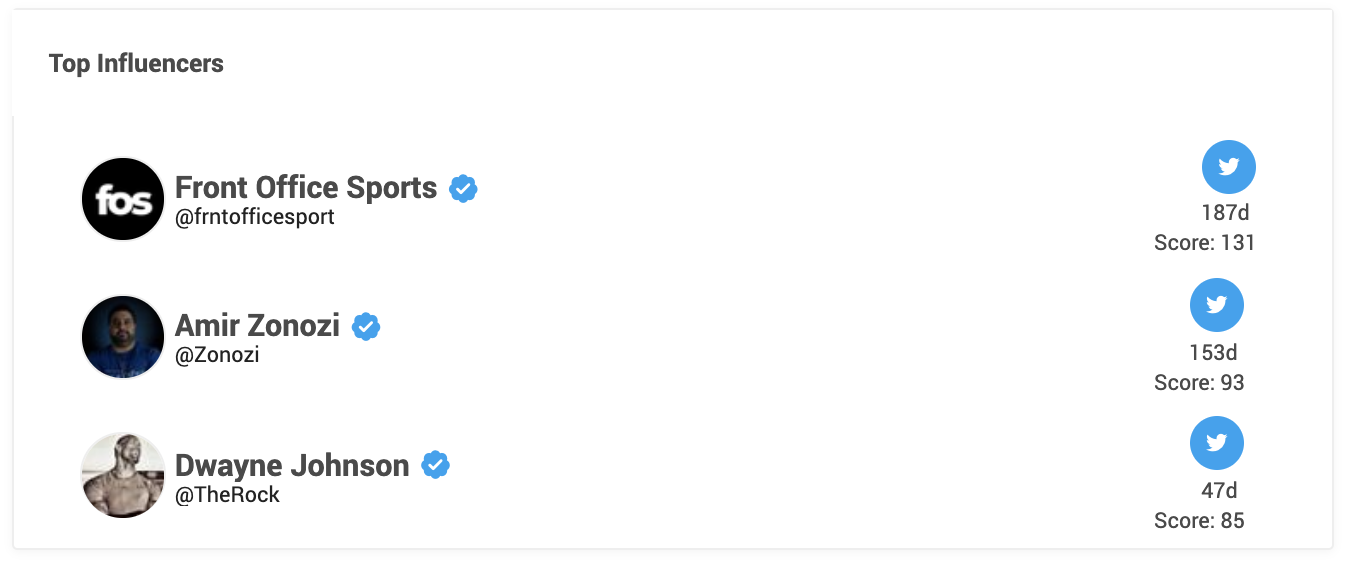
Top Influencers
This is a preview of the top influencers in your feed. You can click on each influencer to reveal their most engaging post, and the full influencer discovery tool can be accessed via your left navigation menu.
 Top Words
The Top Words feature gives you a breakdown of the trending words, hashtags, mentions, emojis, and biography words within your feed. Use this to understand the language that your audience speaks, the topics they post about, and how they identify themselves. You may learn something about your audience that would never know otherwise just by tracking what they post about your brand or organization.
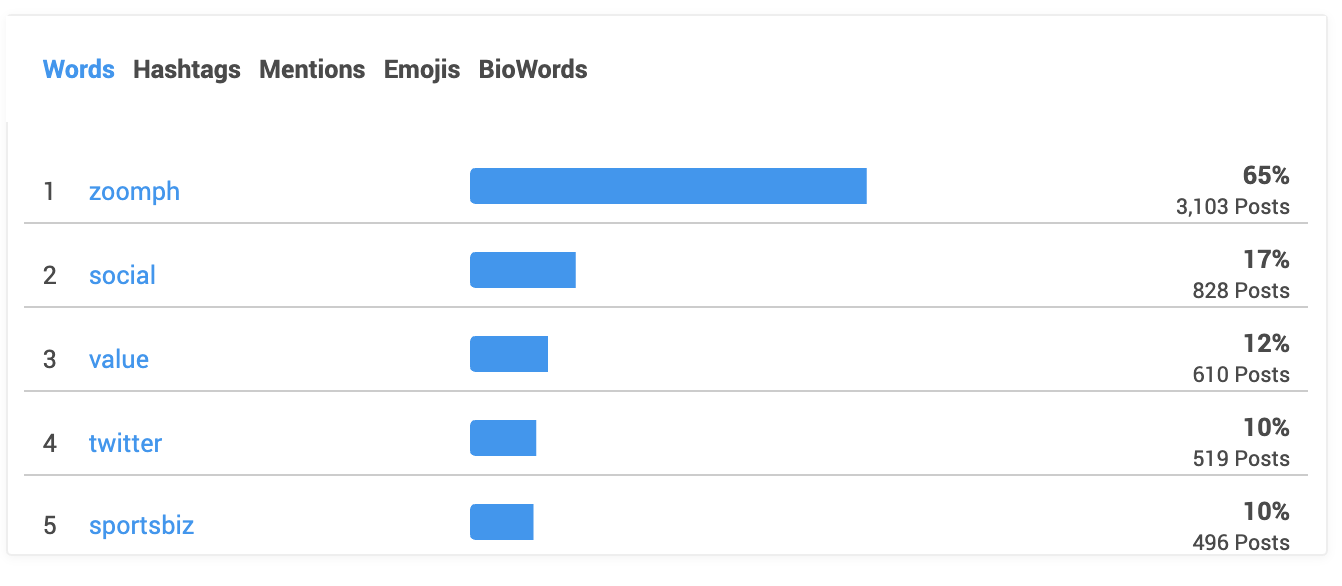
Clicking on a word in either view will take you to moderation and show you all of the content in your feed containing that word.