
Introduction
Engaging your audiences begins with knowing who they are.
By combining data from social media, our proprietary database, and custom sources, Zoomph's Audience tools (available with an Enterprise account) help you unpack deep insights about your digital consumers.
This guide will walk you through the different reports and tools in our Audience tool set. Follow the step-by-step instructions to begin analyzing your first audience segment and learn how to personalize your marketing to their unique interests, personalities, and lifestyles.
Table of Contents
- Audience Builder
- Audience Analytics
- Audience Comparison
- Twitter Follower Report
Audience Builder
The first step is to tell Zoomph what audience to look at. You can create one of two types of audiences in Zoomph: static or dynamic. Each will return an audience analytics report (described in the following section) that crunches data around their most up-to-date likes, dislikes, and more.
Navigating to Builder
With your Enterprise account, you can create a new audience from a few different places in the platform:
- Home > Projects > '+ Quick Create' > Audience
- Home > Audiences > '+ New Audience'
Building a Dynamic Audience
Dynamic audiences let you analyze a sample of social media profiles (Twitter and/or Instagram) that match custom criteria. This list will update over time, and can serve as a great tool for researching audiences across multiple channels.
When you elect to create dynamic audience, you'll have to complete the following steps:
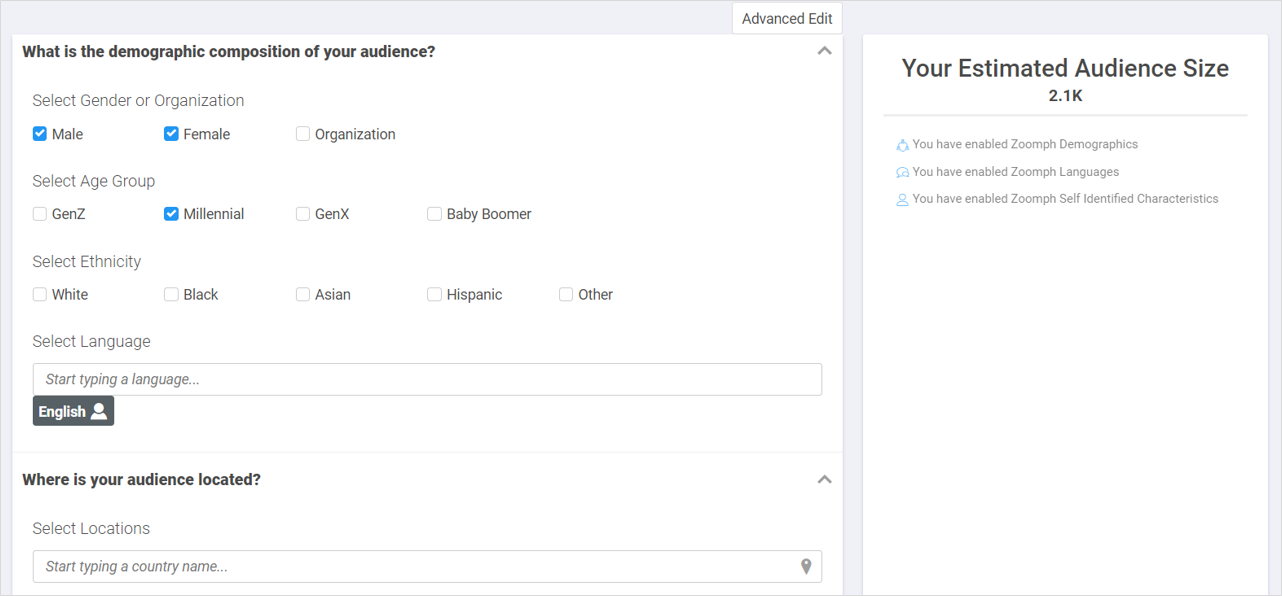
- Define the demographic composition of your audience. This includes their gender, generation, and primary language. If you don't want to filter audiences by any or all of these traits, simply leave the field blank.
- (Optional) Select their location. Zoomph will look at available biographic data and post activity to determine location.
- (Optional) Follow any or all prompts for defining your audience's target interests and social behaviors. Note that some fields are only available for particular channels.
- (Optional) Specify whether you want to look at a Twitter and/or Instagram audience and whether they need to be verified handles or not. You can also set a follower limit if you're looking to analyze just influencers or active handles, as examples.
- Name your audience. This title is for internal view only.
- (Optional) Leave a description that describes the segment you're researching or the goal you're looking to achieve with this audience.
- (Optional) Assign your audience to a project.
- Click SAVE.
Building a Static Audience
Static Audiences allow you to upload a pre-existing list of handles for analysis. Note: You must have received permission from your users to be researched or analyzed in Zoomph. Our platform will return more data around their interests and traits, as inferred from their recent social media activity.
Upload a list in CSV format. You can download the template, or refine your CSV so that it has a column for 'Username' (the handle without the @ symbol) and 'Network.' Audience Builder currently only supports Twitter and Instagram.
After you upload you CSV to Zoomph, you will be asked to create a title and description.
Keep in mind that your static audiences will not update on their own. You must upload a new list when you want to get updated analytics.
Audience Analytics
Go beyond demographic analysis and get to know your consumers by their likes, interests, and more. After you've create an audience, you can analyze these traits anytime and learn how to target your campaigns or communications.
Navigating to Audience Analytics Reports
Open an audience report by either...
- Home > Projects > Audiences > ANALYTICS
- Home > Audiences > ANALYTICS
- Audiences > Analytics

Understanding Your Report
Any audience analytics report will be formatted to show the following traits from top to bottom (see definitions for each term):
- Demographics
- Interests & passions
- Personality traits
- Top terms
- Values
- Socio-economic
- Locations & time
- Affinities
- Accounts followed
Zoomph tracks over 190 default interests and character traits, but can be configured to include custom categories. Contact support@zoomph.com if you would like to add new criteria, and we'll work with you to create the right queries.
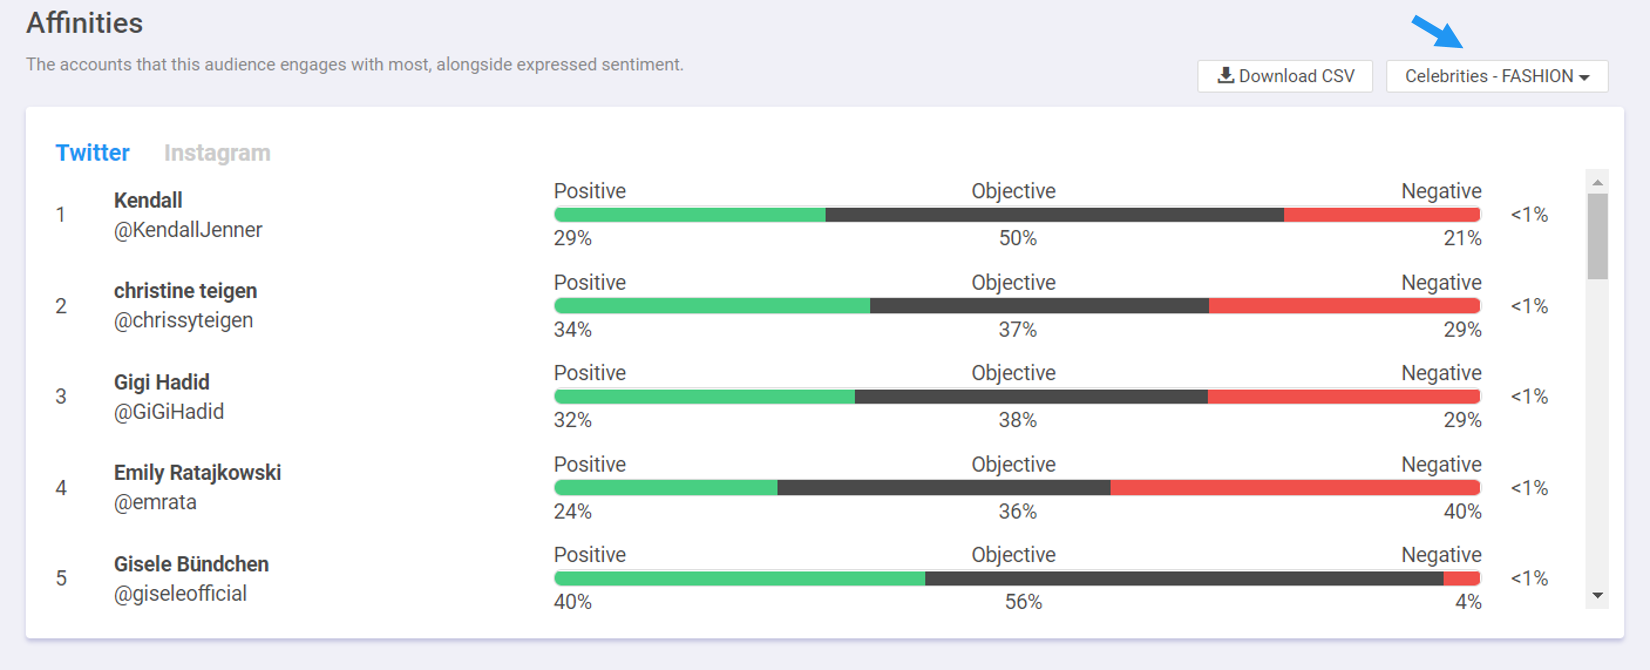
Each chart in your report can be downloaded as a CSV.
They also contain unique sorting options, e.g., you can sort through 'Affinities' by industry. Simply use the drop-down menu above the chart (labeled ALL CATEGORIES) to choose between celebrity, brand, or entertainment affinities from sports, fashion, or other industries.
Filtering by Traits and 'Baseline Skew'
At the top of your report, you'll see a drop-down menu labeled ALL INTERESTS & TRAITS. By clicking on this option, you'll see a list of attributes that you can filter your report by.
Clicking on any of these options will isolate the profiles in your audience who match that criteria, e.g., if you click "Music Interests - Pop Music," your report will reflect data that's specific to people who have an expressed interest in pop music.
Next to this filter option, you'll also see a button labeled NORMAL VIEW. By changing this to BASELINE SKEW, your report will highlight the traits of your audience that stand out when compared to a general audience (either all Twitter, all Instagram, or both). Learn more about baseline skew at the top of this article.
Audience Comparison
Compare any two audiences together, or measure your audience's uniqueness against a general population at depth, with Audience Comparison. This feature is often used for competitive research or for discovering the unique qualities of one customer segment against another.
Navigating to Audience Comparison
- Audience Insights > Comparison > 'Create New Comparison' (or 'View')
Building a Comparison Report
From the configuration page, follow the below steps:
- Choose the two audiences from your account to compare.
- Select a baseline population, which can be either all Twitter, all Instagram, or both.
- Title your report.
- Choose whether to receive an email or not when your report is complete. This will trigger an email to the email address connected to your Zoomph account.
- Click CREATE.
Reading Your Report
You can filter and view your report in multiple ways. By default, your report will show a bar chart of the traits that are most prevalent in (or "skew") your first audience, Audience A. You can change this anytime using the top-right filter of your report.
Browse through the various tabs in your report, which include (see a glossary of terms):
- Interests
- Followed Account
- Bio Words
- Demographics
- Locations
Use the top-right button labeled SORT to change the order of data by Baseline %, Audience A %, Audience B %, or Chi-Square values, e.g., if you choose “Sort by Audience B %,” then the chart will show results from the most-to-least prevalent traits in Audience B—even though the data set as a whole may be specific to Audience A from your earlier filter choice.
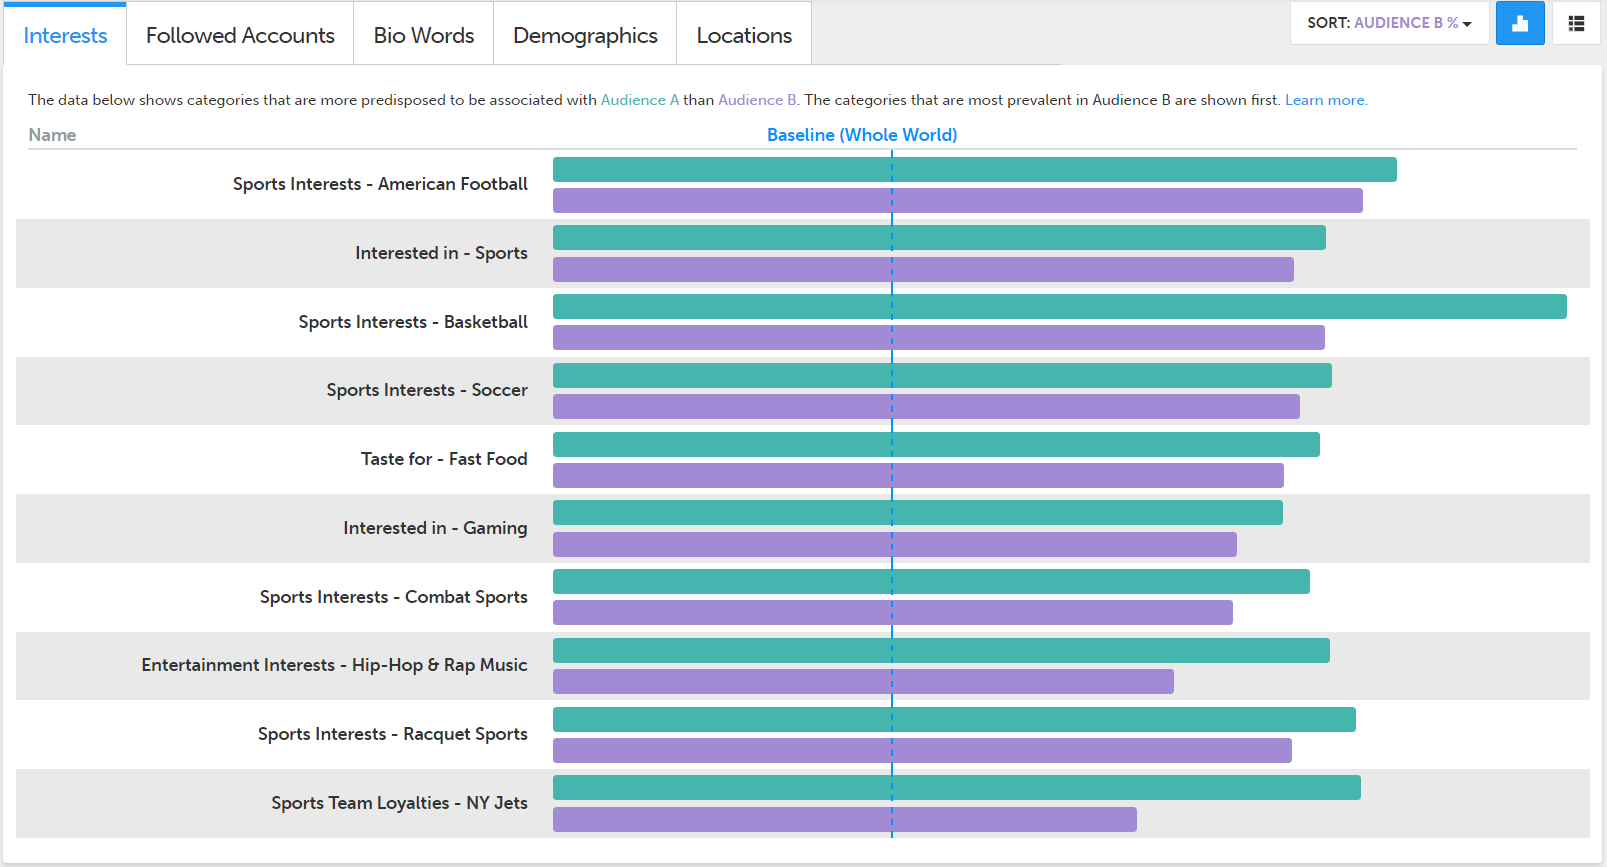
Hover over any bar to get a more exact calculation over a trait's prominence in one audience versus another.
On the bar chart, you’ll also notice a blue line signifying your baseline. Some ways to read this:
- If the bar extends to the right of the baseline (or above the value of 1), it indicates that the category is more likely to be in the audience than in the baseline. A value of 1.4X indicates that the category is 40% more likely to be found in the audience than in the baseline.
- If the bar extends to the left of the baseline (or below the value of 1), it indicates that the category is less likely to be in the audience than in the baseline. A value of 0.7X indicates that the category is 30% less likely to be found in the audience than in the baseline.
For a closer up view of your data, change to the Table View (![]() ).
).
Table View

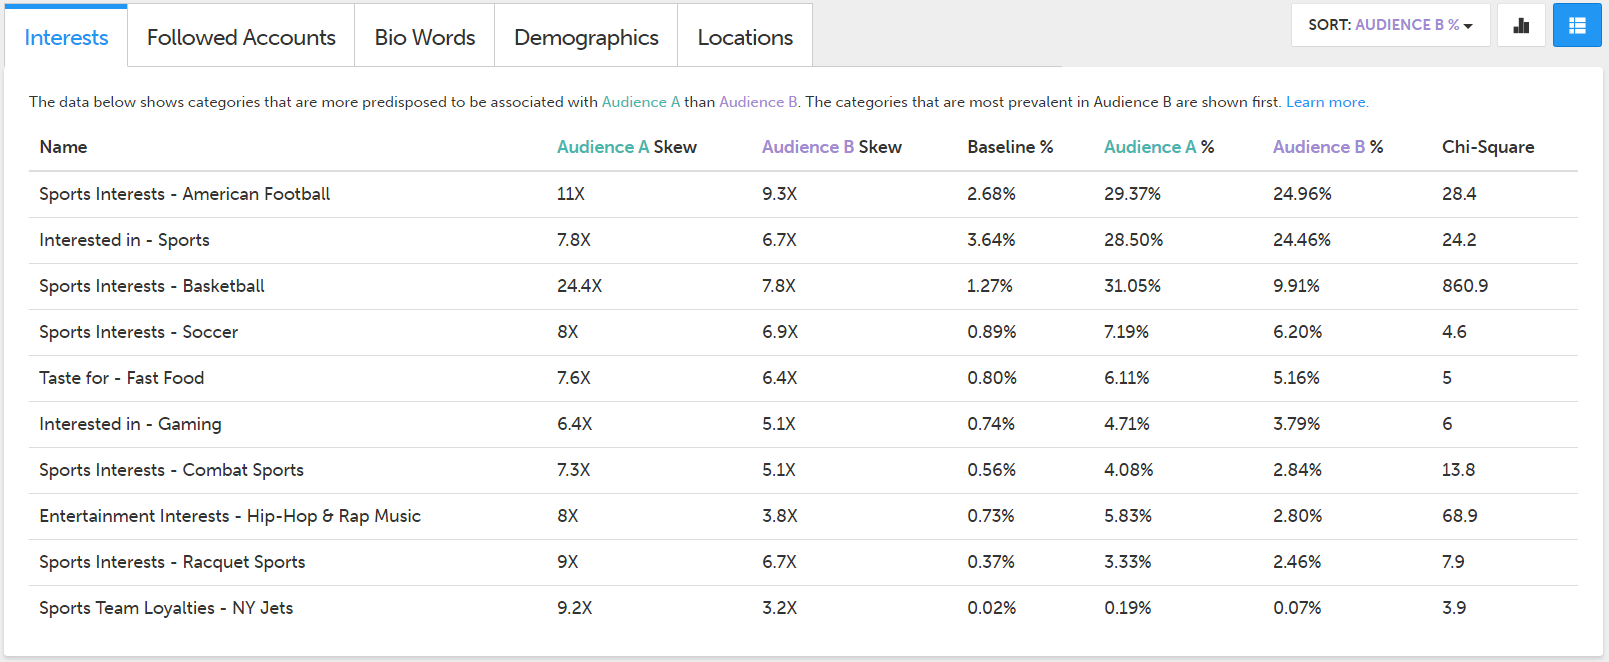
The Table View lets you see exactly what’s happening when you switch filters or sorting options.
We recommend you use this view to analyze specific numbers. From here, you’ll see proportions showing exactly how prominent a category is among your audiences.
On the right side of your table, you’ll see a column for chi-square. Chi square is a statistical test that can be used to see whether two distributions differ from each other. The higher the chi-square value is for a category, the more likely the two distributions are unrelated in that category.
We use chi-square to also evaluate how similar the presence of a category is in both audiences. If you click “Similar Categories” in your filter menu, you’ll receive categories with chi-square values that are lower than a certain threshold—meaning, your audiences have a higher chance of being related in those categories.
Twitter Follower Report
This report makes it easy to assess your Twitter followers or the followers of any other handle. Discover if you're engaging the right people on Twitter or if a potential influencer appeals to the right audience.
Navigating to Twitter Follower Report
-
Audience Insights > Twitter Followers
Building a Report
Creating a report is easy—simply type in the handle you're looking to analyze in the search box.
Understanding Your Report
The first thing you'll see is basic information around the handle, like current follower count, number of tweets, etc.
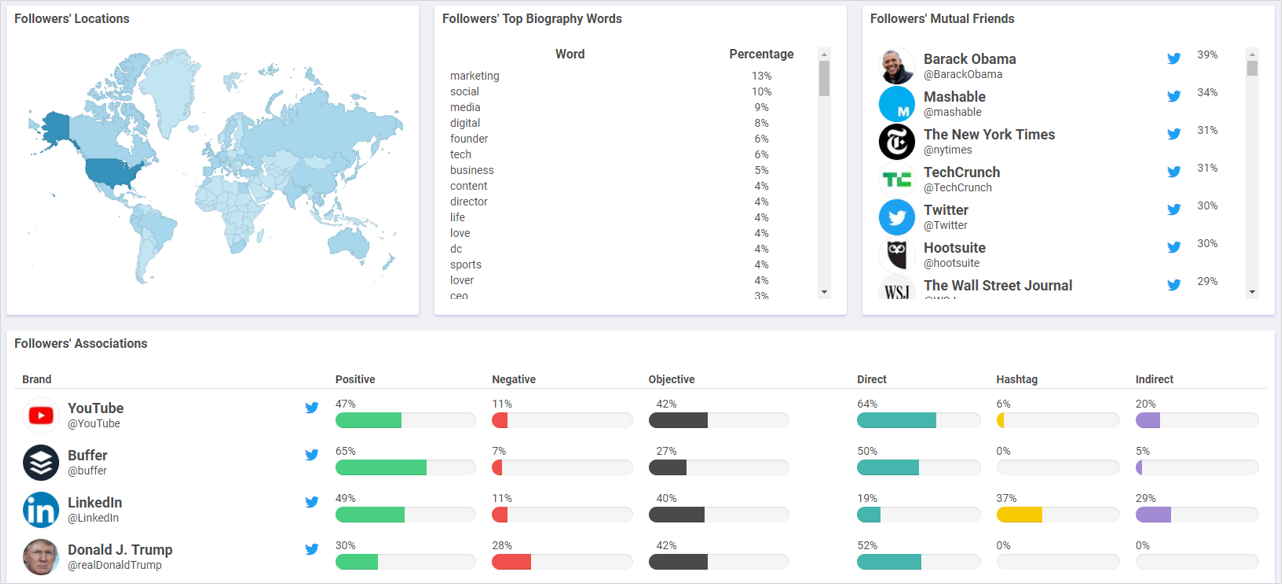
Below this, you'll get a demographic breakdown of their followers and other data, including (see a glossary of terms):
- Checked-in locations
- Top bio words
- Mutual friends
- Brand associations
All the data you see is public information. Our report aggregates these data points across all your followers (or the followers of the handle you've inputted) to provide a statistically valid analysis.
For some charts, you'll see an option to print or downloaded the visual. This is so you can easily share your findings in an email, report, or article.
To analyze another handle, refresh the page or use the search bar in the top-right corner of your report.