Broadcast Schedules Dashboard
This guide will help you understand and make the most of Zoomph’s Broadcast Dashboard, offering powerful tools to track, analyze, and optimize your broadcast performance.

1. Overview of Key Metrics
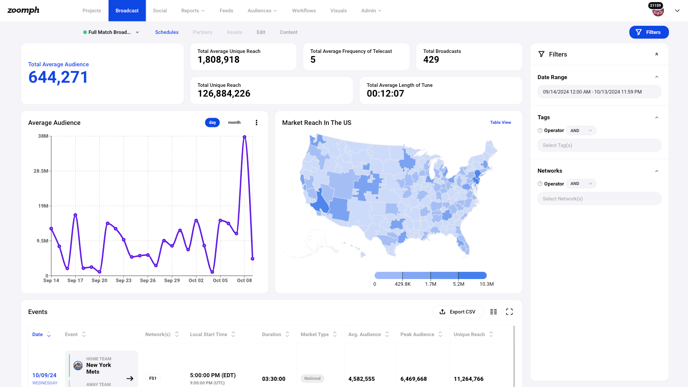
- Total Average Audience: Displays the average number of viewers across all tracked broadcasts during a specified period. This helps you measure overall audience engagement.
- Total Average Unique Reach: This shows the number of unique viewers who have engaged with your broadcasts, helping you understand the scope of your audience.
- Total Average Frequency of Telecast: Indicates how many times, on average, a household watches your broadcast events. It’s a valuable metric for gauging repeat viewership.
- Total Broadcasts: The total number of unique broadcasts within the selected date range.
- Total Unique Reach: A cumulative figure representing all unique viewers who tuned into any of your broadcasts.
- Total Average Length of Tune: The average duration (in hours, minutes, and seconds) that a household watches a broadcast. This is crucial for understanding audience engagement levels.
2. Data Visualization Features
- Average Audience Graph:
- A line chart that tracks audience trends over time (selectable by day or month). This helps you easily identify peaks in viewership and understand when your broadcasts are attracting the most attention.
- Market Reach Map:
- A geographic heatmap that shows the density of viewership across various regions in the U.S. Darker areas indicate higher audience reach, helping you understand where your broadcasts are most popular. You can switch to a table view for more detailed regional data.
3. Events Table
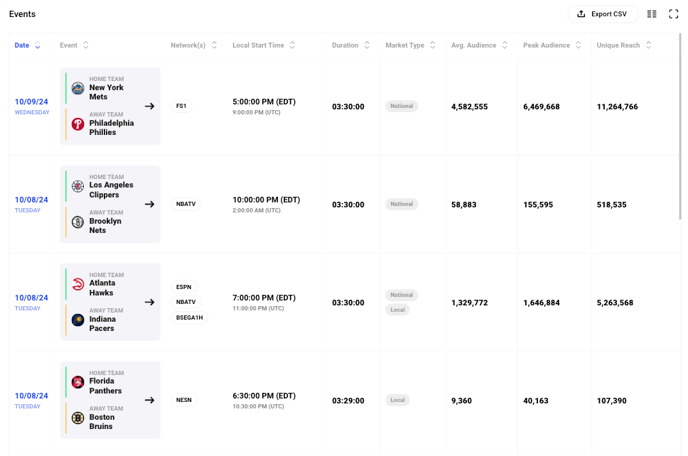
The events table provides detailed performance metrics for each individual broadcast event, including:
- Date: The date of the broadcast.
- Event: The home and away teams or content being broadcast.
- Network(s): The channels or platforms on which the event was broadcast.
- Local Start Time: The scheduled start time of the event (both in local and UTC time).
- Duration: The total length of the broadcast.
- Market Type: Indicates whether the broadcast is national or local.
- Avg. Audience: The average number of viewers during the broadcast.
- Peak Audience: The highest number of viewers during the event.
- Unique Reach: The total number of unique viewers who watched the broadcast.
The table includes sorting and filtering options to help you focus on specific events, networks, or time periods. You can also export the data in CSV format for further analysis.

4. Filters
The filters panel on the right allows you to refine the data being displayed in the dashboard:
- Date Range: Select a custom date range to narrow down the broadcast data you want to view.
- Tags: Use tags to filter broadcasts by operator or specific campaigns.
- Networks: Filter the data by specific broadcast networks to see how they perform individually.
5. Exporting Data
At the top-right of the events table, you’ll find the Export CSV button. This feature allows you to download the entire broadcast dataset for offline analysis or sharing. The export includes all the metrics available in the events table, making it easy to generate reports or deep-dive into specific performance metrics.
6. How to Use This Dashboard Effectively
- Monitor Viewership Trends: Use the Average Audience Graph to track how audience numbers change over time, and identify which events or dates see the highest engagement.
- Target High-Reach Regions: Leverage the Market Reach Map to identify geographic hotspots where your broadcasts are most popular. Use this data to inform regional marketing strategies.
- Optimize Broadcasts: The detailed metrics in the Events Table (like average audience, peak audience, and unique reach) help you determine which broadcasts are performing well. Focus on what’s working and apply those insights to future broadcasts.
- Export Data for Further Analysis: The CSV Export functionality allows you to take a deeper dive into your broadcast data outside the platform. Use it to create custom reports or share performance metrics with stakeholders.
This guide provides a comprehensive overview of the Zoomph Broadcast Dashboard and its powerful features. By utilizing the dashboard effectively, you can gain deeper insights into your audience, optimize your broadcasts, and make data-driven decisions to improve your overall strategy.
